Visualization of interrelations (IRs) among 1K categories
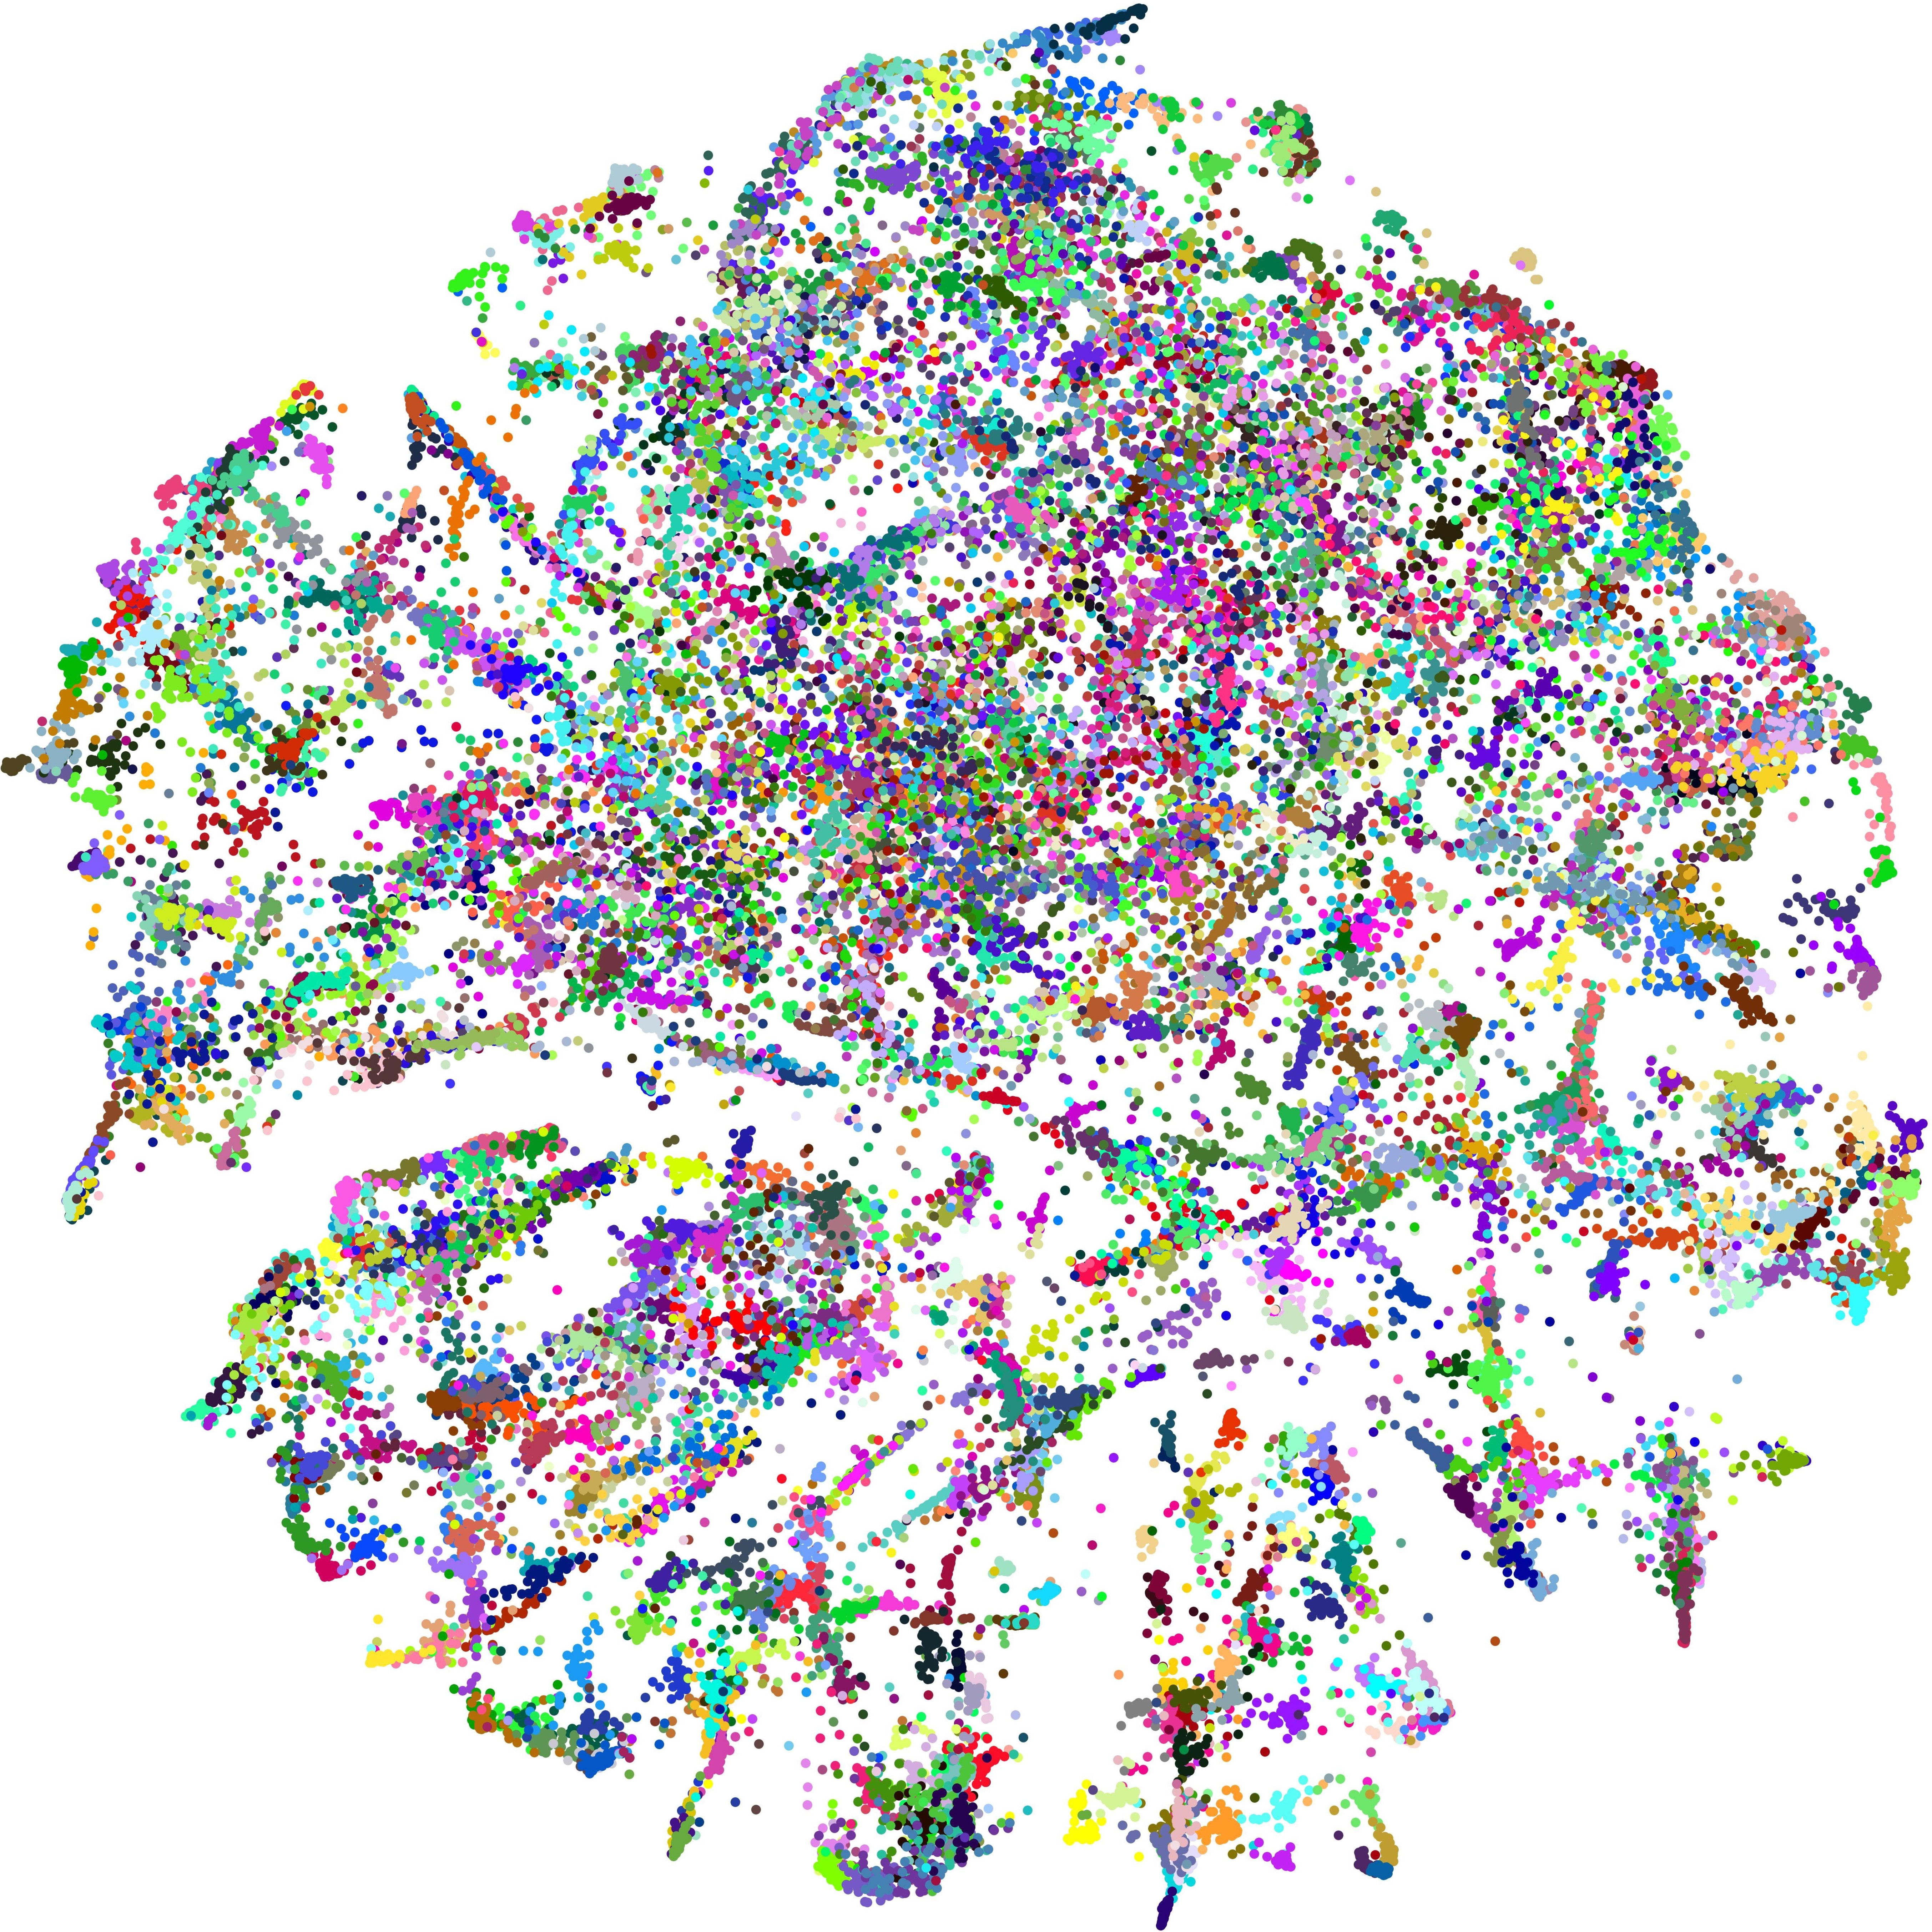
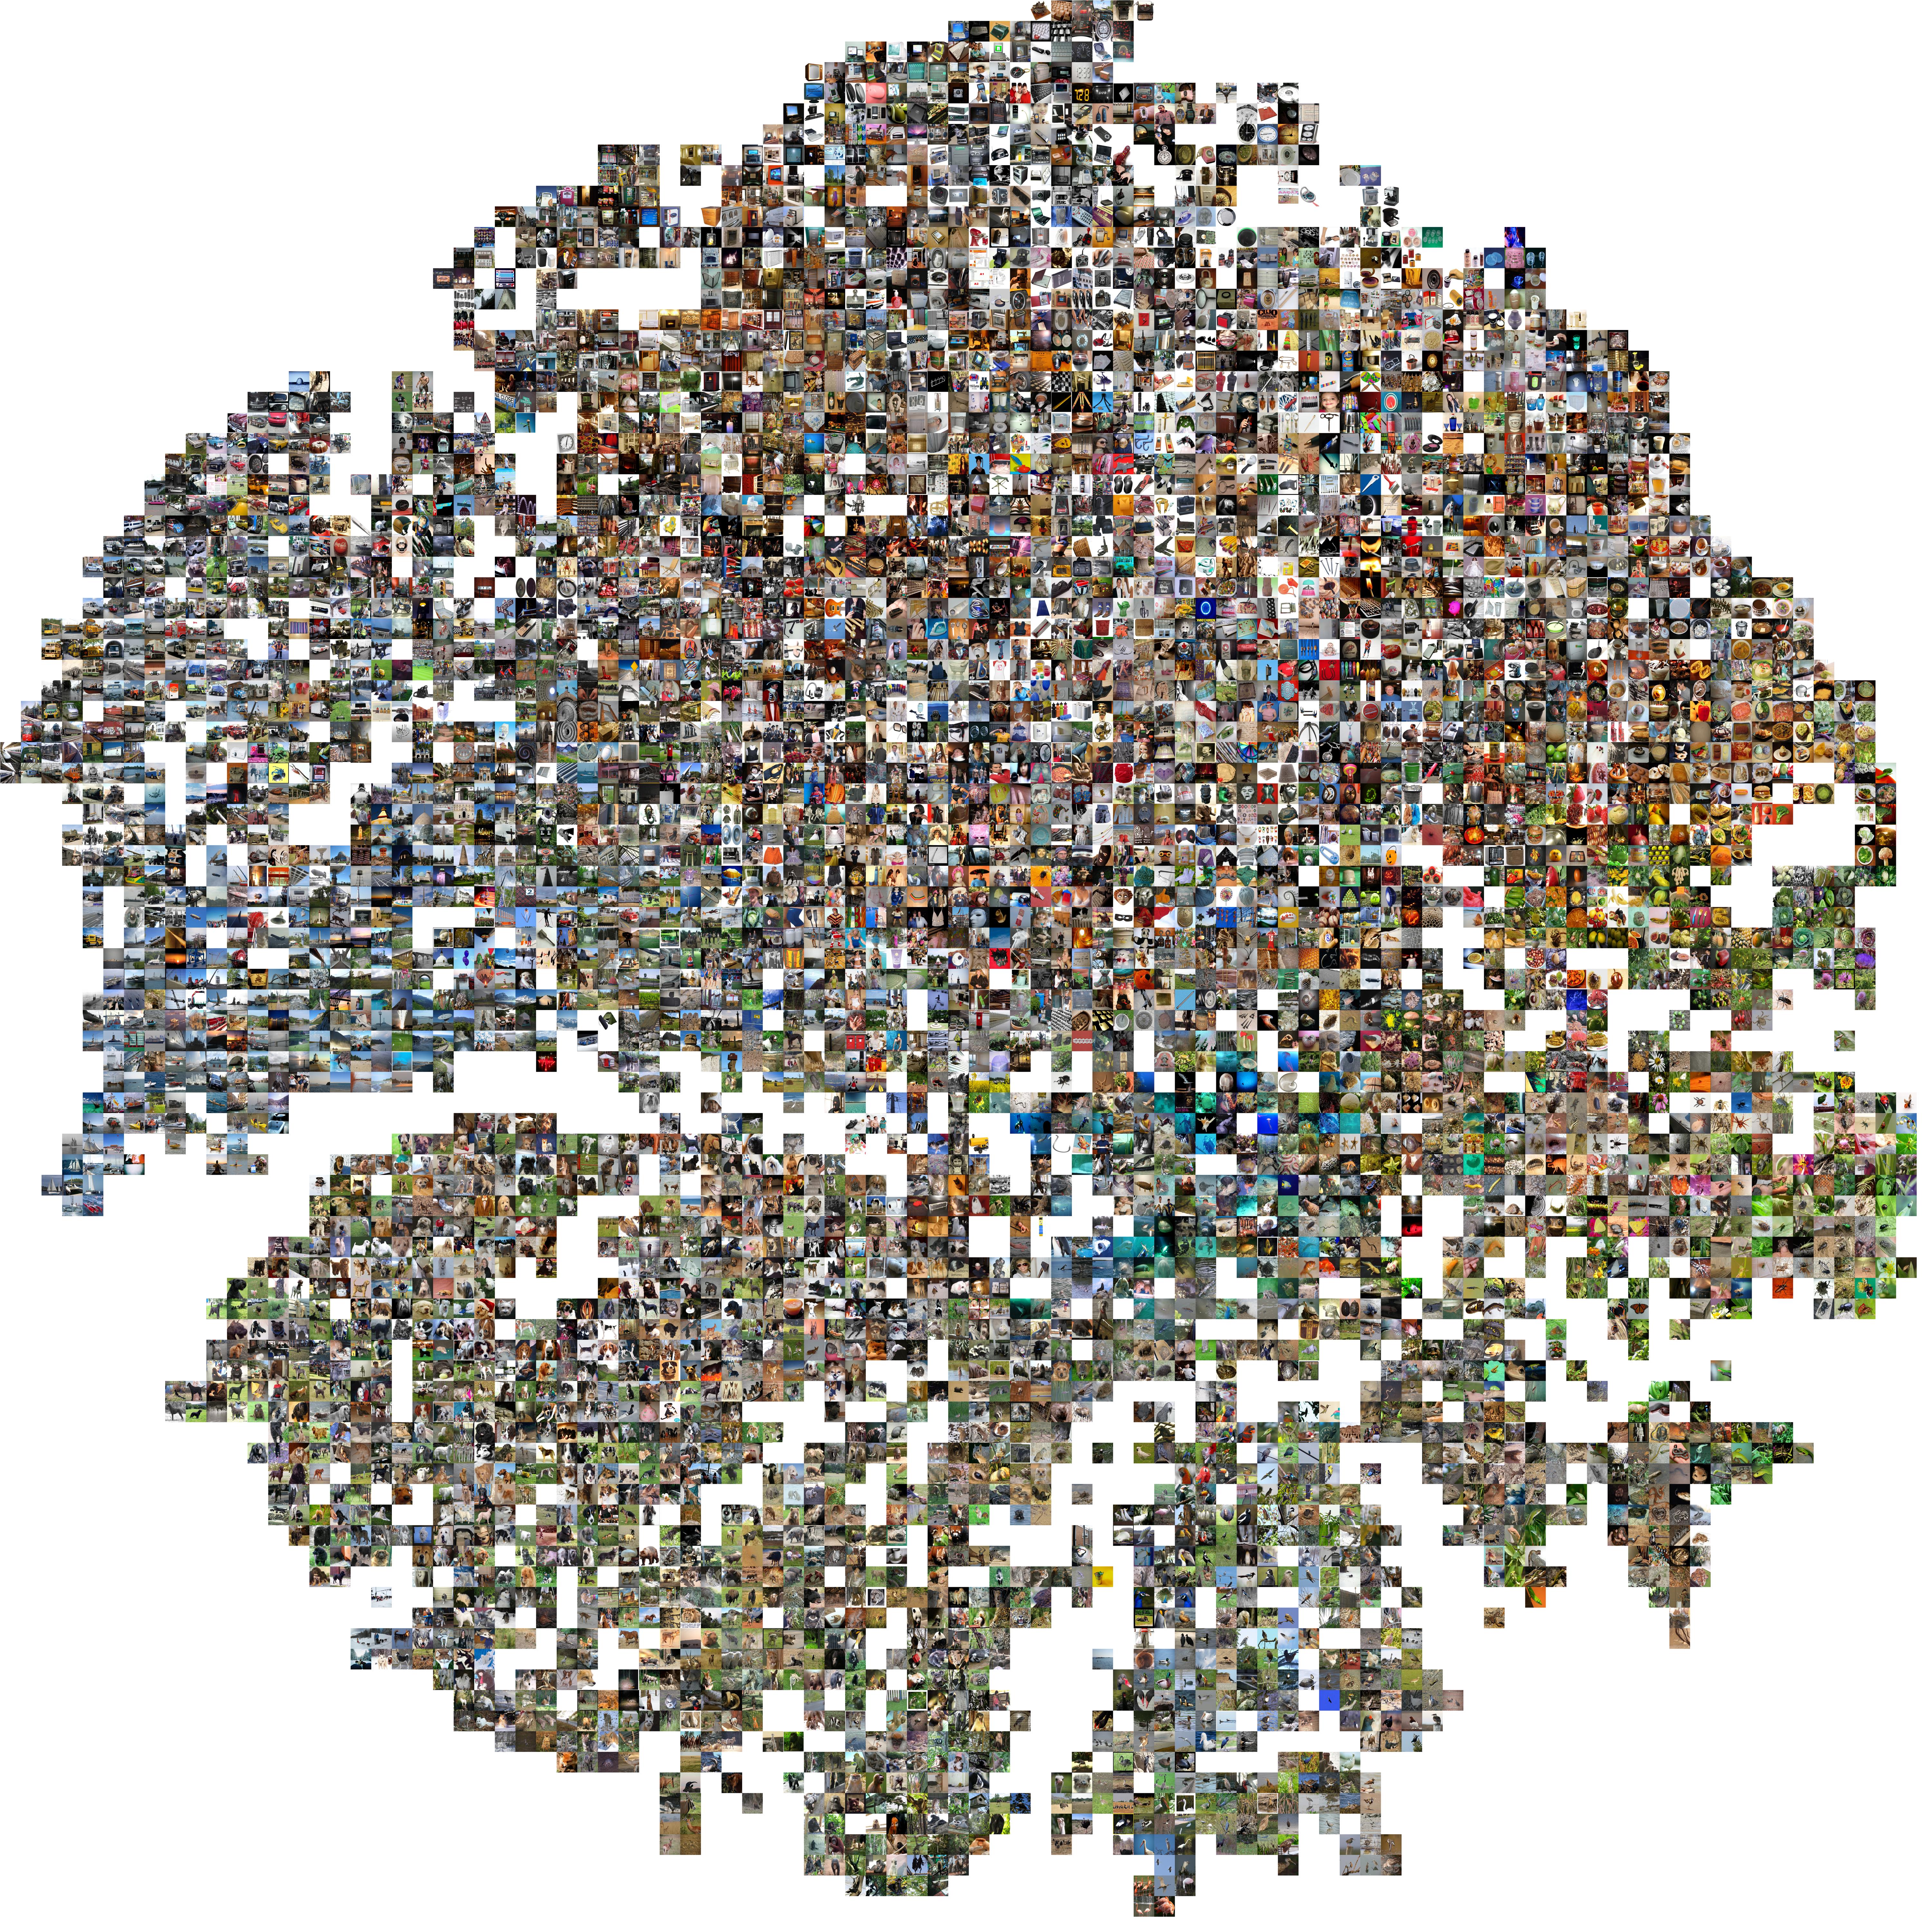
We quantify IR between two categories as their feature similarities. For visualization of IRs, we randomly select 50 images per category on training set of ImageNet and extract their features with the pre-trained ResNet50 model. Then we project the features into 2D space using t-SNE, and show the 2D embedding points in Figure I. For intuitive understanding, we display the features by the corresponding images at their nearest 2D embedding locations in Figure II.
|
Figure I: Features of 1K categories are projected to 2D space using t-SNE where different categories are indicated by different colors. The categories exhibit complex topological relations in the feature space, which encode rich information and are beneficial for knowledge distillation. |

